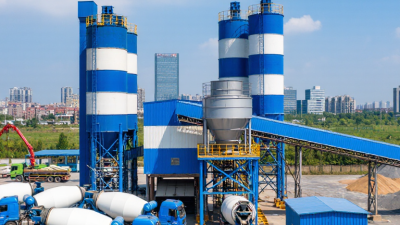
Top Ready Mix Cement Delivery Suppliers Worldwide
The global ready mix cement delivery market supports roads, housing, bridges, ports, and industrial facilities. In practice, suppliers deliver more than cement. They coordinate aggregates, water, admixtures, batching systems, trucks, and site schedules. A delayed truck can leave a pump standing beside fresh formwork. That detail matters.
The Global Cement and Concrete Association reports that more than 14 billion cubic metres of concrete are produced annually worldwide. This scale reflects concrete’s central role in modern construction. However, it also creates demanding supply-chain challenges. The International Energy Agency estimates that cement production contributes roughly 7% of global energy-related carbon dioxide emissions. Therefore, leading suppliers increasingly combine dependable delivery with lower-carbon mixes, recycled materials, digital dispatching, and efficient vehicle routes.
This guide examines top ready mix cement delivery suppliers across major regional markets. It considers production capacity, plant coverage, fleet reliability, testing procedures, technical support, and customer feedback. Standards such as ASTM, EN, and national concrete specifications also influence supplier selection. A strong provider should offer consistent slump control, accurate batching, traceable material records, and practical placement guidance. Experience remains important, especially when weather, traffic, or complex pours disrupt plans. Still, no global ranking can be perfectly neutral. Local prices, transport distances, and certification requirements change the outcome. Some smaller suppliers may outperform larger groups on responsiveness. That possibility deserves attention. The following overview uses recognized industry research and operational criteria to compare dependable options for contractors, developers, and infrastructure teams.
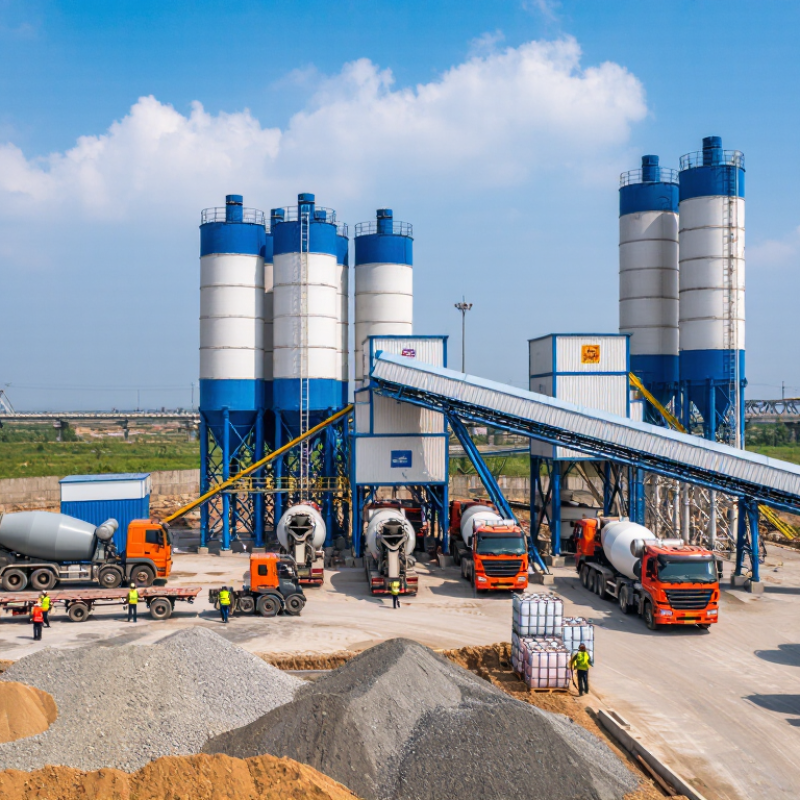
Ready-Mix Concrete Defined: ASTM C94, EN 206, and 28-Day Strength
Ready-mix concrete is more than cement, water, and aggregate delivered by truck. It is a controlled construction material with measurable performance. The Global Cement and Concrete Association reports that the world uses nearly 14 billion cubic metres of concrete annually. That scale makes consistent testing essential.
ASTM C94 defines requirements for ready-mixed concrete production, delivery, and acceptance. It does not prescribe one universal strength class. Project documents must state the required performance, slump, air content, temperature, and testing method. Compressive strength is commonly verified at 28 days under ASTM C39 procedures. A supplier may deliver a workable mix, yet poor sampling can still produce misleading results.
EN 206 uses characteristic compressive strength classes, such as C25/30. The first value refers to cylinders; the second refers to cubes. That difference matters during international procurement. The European Commission’s Joint Research Centre identifies durability, exposure conditions, and service life as central concrete design factors. Strength alone is not enough.
The truck clock matters.
Site teams should record batch time, arrival time, weather, slump, and specimen details. Water added without approval can change the water-cement ratio and weaken the tested result. I have found that paperwork is often treated as secondary, although it may reveal the real quality problem. Standards improve reliability, but human judgment still needs checking.
Supplier Ranking Criteria: Plant Capacity, Fleet Size, and Annual Output
Top Ready Mix Cement Delivery Suppliers Worldwide
Reliable supplier rankings should begin with plant capacity. A large, well-maintained plant can support major construction schedules without frequent production gaps. However, stated capacity may reflect ideal conditions, not daily performance. Buyers should review operating records, maintenance schedules, and peak-season delivery data. Site visits can reveal practical details, such as storage conditions, loading speed, and backup power.
Fleet size matters because ready mix concrete has a limited delivery window. A supplier with many mixer trucks can reduce delays during pours. Yet truck numbers alone prove little. Check vehicle age, maintenance records, driver training, and dispatch systems. GPS tracking and live delivery updates can improve coordination. A smaller fleet may still perform better when routing is disciplined. That is worth remembering.
Tips: Compare annual output with local demand, not global figures. Ask for verified production records and recent project references. Confirm whether trucks are company-owned or subcontracted. Review average delivery times, rejected loads, and emergency response procedures. No ranking is perfect. Conditions change.
Annual output provides another useful benchmark. It shows experience across different project sizes and scheduling pressures. Still, high output does not automatically guarantee consistent quality. Independent testing, documented mix designs, and batch records provide stronger evidence. Look for suppliers that explain limitations clearly. Honest uncertainty is often more reliable than impressive promises.
Quality and Sustainability: ISO 9001, SCM Content, and CO₂ per m³
Top Ready Mix Cement Delivery Suppliers Worldwide
Quality and sustainability now depend on measurable details, not delivery speed alone. ISO 9001 certification shows controlled processes, but it does not prove lower emissions. The International Energy Agency reports that cement production creates about 7% of global energy-related and process CO₂ emissions. Therefore, buyers should request mix-specific carbon data, not broad environmental claims. CO₂ per m³ can change with cement dosage, strength class, transport distance, and curing conditions.
Supplementary cementitious materials, or SCMs, can reduce clinker demand. Common options include slag, fly ash, and calcined clay. However, SCM availability varies by region, and higher replacement may affect setting time or early strength. The Global Cement and Concrete Association identifies clinker reduction as a key pathway toward net-zero concrete. This sounds straightforward. It is not always practical. A low-carbon mix may require longer curing, extra testing, or careful scheduling at the site.
Tips: Ask for a current, independently verified EPD under EN 15804. Compare CO₂ per m³ at the same strength and exposure class. Check ISO 9001 scope and audit status. Request batch tickets, temperature records, and SCM percentages. One overlooked delivery delay can increase waste and site emissions. I would also review real project evidence, because polished sustainability language can hide inconsistent field performance.
Worldwide Supplier Comparison: Price per m³, Lead Time, and Compliance Data
Top Ready Mix Cement Delivery Suppliers Worldwide
Comparing ready-mix suppliers requires more than a headline price. Public 2024 construction-cost schedules commonly place standard concrete near USD 90–180 per m³, before pumping, taxes, and difficult access. Regional labor, aggregate quality, and fuel costs create wide gaps. Treat this range as a screening figure, not a quotation.
Lead time needs clearer definition. Is it booking-to-pour, or factory-to-site? For urban projects, 24–72 hours is often practical when production capacity is available. Cross-border procurement may require several weeks for permits, testing, and transport coordination. The World Bank’s Logistics Performance Index 2023 shows major differences in customs efficiency and delivery reliability between markets. Ready-mix is especially sensitive to delay. Concrete waits poorly.
Compliance data should be verified batch by batch. Request mix-design approval, strength-test results, plant calibration records, and delivery tickets. EN 206 and ASTM C94 provide useful reference points for concrete specification and delivery control. However, certificates alone can mislead. Local standards may impose different exposure, curing, or sampling requirements. Independent laboratory checks remain valuable.
Environmental performance also deserves attention. The Global Cement and Concrete Association’s 2050 Roadmap identifies cement production as responsible for roughly 7% of global carbon dioxide emissions. Ask for recycled aggregate content, cement replacement rates, and verified embodied-carbon data. Some suppliers report impressive figures, but boundaries differ. Compare the methodology, not just the number. Pricing is important; traceability is harder to fake.
Top Ready Mix Cement Delivery Suppliers Worldwide - Worldwide Supplier Comparison: Price per m³, Lead Time, and Compliance Data
Anonymous regional benchmark comparison for standard ready-mix concrete delivery. Prices are indicative commercial ranges in USD per m³, excluding VAT, pumping, special admixtures, and long-distance surcharges.
| Supplier Profile |
Primary Market |
Typical Concrete Grade |
Indicative Price per m³ |
Standard Delivery Lead Time |
Minimum Order |
Normal Delivery Radius |
Compliance Frameworks Commonly Offered |
Batch Documentation |
Typical Dispatch Capacity |
Operational Reliability |
| Regional Profile A |
Western Europe |
C25/30 to C35/45; slump class S3–S4 |
$125–$190 |
24–72 hours |
4–6 m³ |
20–35 km from plant |
EN 206; EN 12350 testing; national execution requirements |
Delivery ticket, mix designation, batch time, quantity, slump record where requested |
6–12 m³ per truck |
★★★★☆ |
| Regional Profile B |
North America |
3,000–5,000 psi; air-entrained options available |
$145–$220 |
24–96 hours |
4–6 yd³ |
15–40 miles from plant |
ASTM C94/C94M; ASTM C31/C39 testing; project specifications |
Ticket with mix code, truck number, loading time, quantity, water and admixture records |
8–12 yd³ per truck |
★★★★☆ |
| Regional Profile C |
Australia and New Zealand |
20–40 MPa; exposure-class mixes available |
$150–$240 |
24–96 hours |
3–5 m³ |
20–45 km from plant |
AS 1379; AS 1012 testing; NZS 3104 for applicable projects |
Batch docket, nominated strength, slump target, delivery time and volume |
5–9 m³ per truck |
★★★★☆ |
| Regional Profile D |
Gulf Cooperation Council |
30–50 MPa; hot-weather and sulfate-resistant mixes |
$75–$145 |
24–72 hours |
5–7 m³ |
15–30 km from plant |
ASTM C94/C94M; BS EN 206 where specified; local authority requirements |
Delivery ticket, temperature record when specified, mix design reference and quantity |
6–10 m³ per truck |
★★★★☆ |
| Regional Profile E |
East Asia |
24–40 MPa; pumpable and high-workability options |
$65–$130 |
24–72 hours |
4–6 m³ |
15–35 km from plant |
JIS A 5308 or GB/T 14902, depending on country and project |
Dispatch ticket, mix category, loading time, truck identification and volume |
6–10 m³ per truck |
★★★★☆ |
| Regional Profile F |
Southeast Asia |
20–40 MPa; tropical-weather and pump mixes |
$55–$115 |
24–96 hours |
3–6 m³ |
10–30 km from plant |
ASTM C94/C94M, EN 206, or applicable national concrete standards |
Basic batch ticket; test certificates generally available by prior request |
5–9 m³ per truck |
★★★☆☆ |
| Regional Profile G |
India and South Asia |
M25–M40; standard, pumpable and rapid-strength mixes |
$45–$95 |
24–96 hours |
3–5 m³ |
10–25 km from plant |
IS 4926; IS 456 project requirements; laboratory testing to applicable IS methods |
Batch ticket and mix identification; compressive-strength reports on request |
4–8 m³ per truck |
★★★☆☆ |
| Regional Profile H |
Latin America |
20–35 MPa; structural and pumpable mixes |
$70–$145 |
24–96 hours |
4–6 m³ |
15–35 km from plant |
Applicable national standards; ASTM or EN methods frequently used for project testing |
Delivery ticket, volume, mix reference, dispatch time and truck number |
5–9 m³ per truck |
★★★☆☆ |
| Regional Profile I |
Sub-Saharan Africa |
20–35 MPa; conventional and site-access mixes |
$80–$170 |
48–120 hours |
4–6 m³ |
10–30 km from plant |
BS EN 206, ASTM C94/C94M, or national standards depending on project |
Delivery ticket commonly available; independent test certificates may require advance booking |
5–8 m³ per truck |
★★★☆☆ |
| Regional Profile J |
Central and Eastern Europe |
C20/25 to C35/45; freeze-thaw and air-entrained options |
$100–$175 |
24–72 hours |
4–6 m³ |
20–40 km from plant |
EN 206; EN 12350; EN 12390 strength testing |
Delivery ticket, conformity information, mix class, quantity and loading time |
6–10 m³ per truck |
★★★★☆ |
Comparison notes:
Price ranges represent typical market quotations for ordinary ready-mix concrete and can change significantly with cement type, aggregate availability, order volume, pumping requirements, traffic restrictions, fuel costs, placement time, weather conditions and project location. Lead times assume normal plant availability and a confirmed site access plan. Compliance should be verified against the current project specification, local building regulations, batch records and independent laboratory test results before purchase.
Reference standards represented in this comparison include EN 206, ASTM C94/C94M, AS 1379, NZS 3104, JIS A 5308, GB/T 14902, IS 4926 and related concrete testing standards. All figures are benchmark ranges rather than quotations from named companies.